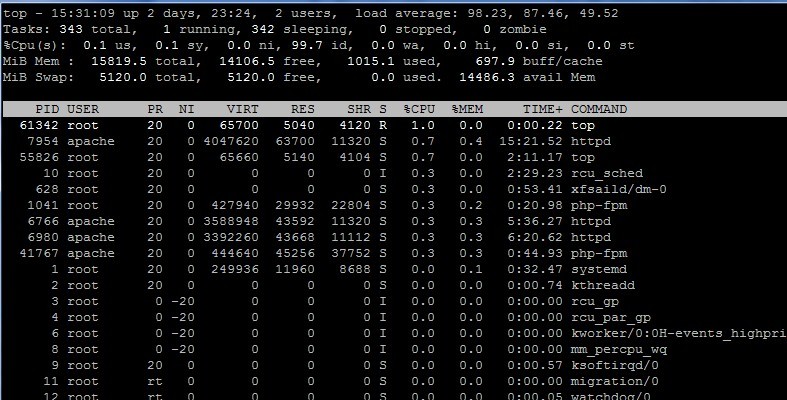
A database virtualization server lesson. We recently suffered a serious problem where a large portion of the infrastructure serving OutagesIO members would come to a crawl. At first, it seemed that the main database (MariaDB) was locking up but we soon noticed the Linux servers connecting to that database were also locking up, many hitting 100 load. High loads with no unusual memory/CPU loads either. The image above shows an example.
The most frustrating aspect in initially troubleshooting was that it was rare and I wasn’t able to replicate the problem. It was difficult to monitor and very random. Database virtualization is a common practice for smaller web servers and applications.
The service back end includes various clusters, load balanced servers and others working independently and/or with combined output for redundancy. I started monitoring server loads, memory/CPU usage as a basic starting point.
I noticed that when it would happen, the load balancer would show all of the servers not responding on port 443. Were we under some sort of attack? I eliminated that too but now thought I had a lead. I removed load balancing so I could monitor a single server for each function where possible.
It happened again. It would happen suddenly and with no obvious way of stopping it. I would see the load going up on a server, all the way to 100 over the course of maybe a few minutes. Load was way up but memory/CPU was normal. I checked the database server and everything was normal. I ran iperf and there was plenty of bandwidth.
I stopped server services that were connecting to the database which seemed to show a slow but gradual lowering of load. Sometimes, in a panic, I figured maybe doing the one thing I hate most, rebooting servers. I rebooted all of the servers that had high loads. No substantial change. Then it just went away, as usual.
Stumped. I installed Percona monitoring and after a while of monitoring, still nothing obvious other than some long running queries that we were aware of. The mariadb tune looked very good yet this would happen. It started getting worse.
I got one of the devs involved to get some additional eyes on the problem but it was futile. We spent weeks monitoring but the problem kept eluding us.
I suspected everything from Linux socket limits, open file limits, sysctls settings, client connection and/or timeout limits, nfs and found nothing. I tested different configs on Apache and php with no changes. Still, random lockups.
Each of these servers has a minimum of 16GB and at least 8 vCPU’s and neither of those resources were tasked.
I kept suspecting a network issue, thinking maybe clients are getting cut off or maybe the 10GbE links were somehow maxing out, bad drivers and so on but non of these things seemed to be the cause. Nperf tests showed consistently good network speeds. What’s going on?
I did consider the virtual database server but as I didn’t see any substantial resource useage on the host, I didn’t focus on that.
Then one day, the mariadb service stopped and restarted itself, something I had never seen before. From that point on, things only got worse and it demanded all our attention. I considered hiring a database specialist but I would have been billed for the exact same things we were doing at the time, trying to find leads to ultimately solve the problem.
The most interesting thing was when the lockup would occur, many of the web servers would go to 100 load , preventing connections while the database server seemed to be fine. No heavy load, no additional memory being used but nothing could connect to it.
This certainly made it look like it was a client issue and not a db issue but we still didn’t know what it was though it was costing us time, money, members and a lot of stress.
I finally decided to post a question on a site I consider to be an amazing resource called Experts Exchange. That question might have some kind of award pending for the longest question ever on the site. No idea if it actually is but here is that question.
A number of IT people jumped in to help and the thread grew and grew. Countless ideas for tests came up and we tried pretty much everything being suggested that had not been tried before.
I didn’t realize it at the time but part of the answer was the very first comment. A suggestion to move everything to a completely seperate setup. Then someone mentioned that the problem could be because I virtualized the database server.
Because it wasn’t clear what the problem was, it was hard to consider such a drastic decision as basically rebuilding. Most of the people helping on EE are like me, they are doing this kind of work every day so the input is from experience. Database virtualization is well known to many of those folks.
We spent a lot of time talking about tuning the database and it all came around, back to the server being a virtual one.
And just like that, it all came to light
This database had recently been moved from a bare metal server to a virtual server. My thought was to dedicate an entire blade running a Proxmox host with only one vm on it, a centos 7.9 server mariadb 10.5.
The blades have 256GB and 48 vCPU’s so I gave the single vm 128GB of memory and 44 of the vCPU’s. My thinking was that if the vm worked well, then I could adjust as needed and maybe even maximize the blade by adding low resource usage vms later.
In the post, I had mentioned how I was seeing high CPU and memory usage on the Proxmox host but was not seeing the same on the virtual server. I also mentioned seeing Proxmox continuously showing over 80% of the memory use yet the vm itself showed a maximum use of 55GB or so, nowhere near the 128GB I assigned it.
I was very new to using Proxmox and especially a fairly high traffic virtualized database.
Then someone mentioned this;
proxmox uses KVM for running VMs (or native kernel when running a container).
The resources shown are most probably from the KVM process.. (emulating the VM)
There is overhead involved in emulation, the Host will show including overhead, the guest won’t know about the overhead.
(memory wise: KVM code, Caches, IO Buffers.. etc. CPU wise: handle various IO tasks, housekeeping of caches / translating
certain code sequences)
162GB is used is used in ALL processes.
The KVM process on top is your DB. vm… – seems close to 128GB, the overhead there is 131.5 – 128 = 3.5GB… ~2%.
with 125GB resident in memory. (The OS inside the the VM is included in that 128GB ) (The memory there is allocated by
the initialization of the Guest’s OS). The disk emulators (cpq…*) = 1GB each. The OS of proxmox will take some space as well.
If load is the one on top… that is the amount of active processes… Another consideration: having 44 CPU’s also means 44 active
elements contending for single resources (table rows). you may need less cpu’s and find that causes less locking issues as
the work gets aligned more by queuing.
Then someone added this;
i believe your apparent resource issues are related to zfs. Virtualization of a db is not a very good idea. doing it over
zfs and proxmox is a terrible one as zfs on linux is NOT mature enough for busy servers. at least not without lots of
tweaking.
additionally as far as i remember, proxmox uses the fuse version, a significantly outdated kernel, and you cannot benefit
from virtio. it is ok if you provide a raw zfs pool to the vm as a block device but other setups are just asking for trouble.
and anyway you probably should not virtualize the dbs at all.
While I’ve run LAMP servers on bare metal and vms for a very long time as vms, they are relatively low traffic compared to this database. As it turns out, for the amount of connections and traffic, even though it’s a small database, the virtualized database server or the host or both combined could not keep up. It appears that Proxmox was in fact bogging down so everything trying to connect to the db vm simply stopped.
I decided to rebuild the server/service with its own blade using FreeBSD. After moving the databases over, the problems ended instantly. Same tune (my.cnf), same traffic, everything back to normal, not one single problem since.
From there, we were able to get back to analyzing slow queries and other issues and found we had disabled a cache and had an error in some queries that caused a full index scan on every connection. Those things combined were causing a huge resource loss but virtualizing a busy db server was a bad idea indeed.
Mike Paradis
Founder, OutagesIO.com